Tuesday, 13 October 2026
Why India's infrastructure story keeps getting stuck between plan and progress
Why India's infrastructure story keeps getting stuck between plan and progress
 Lalita Subrahmanyam
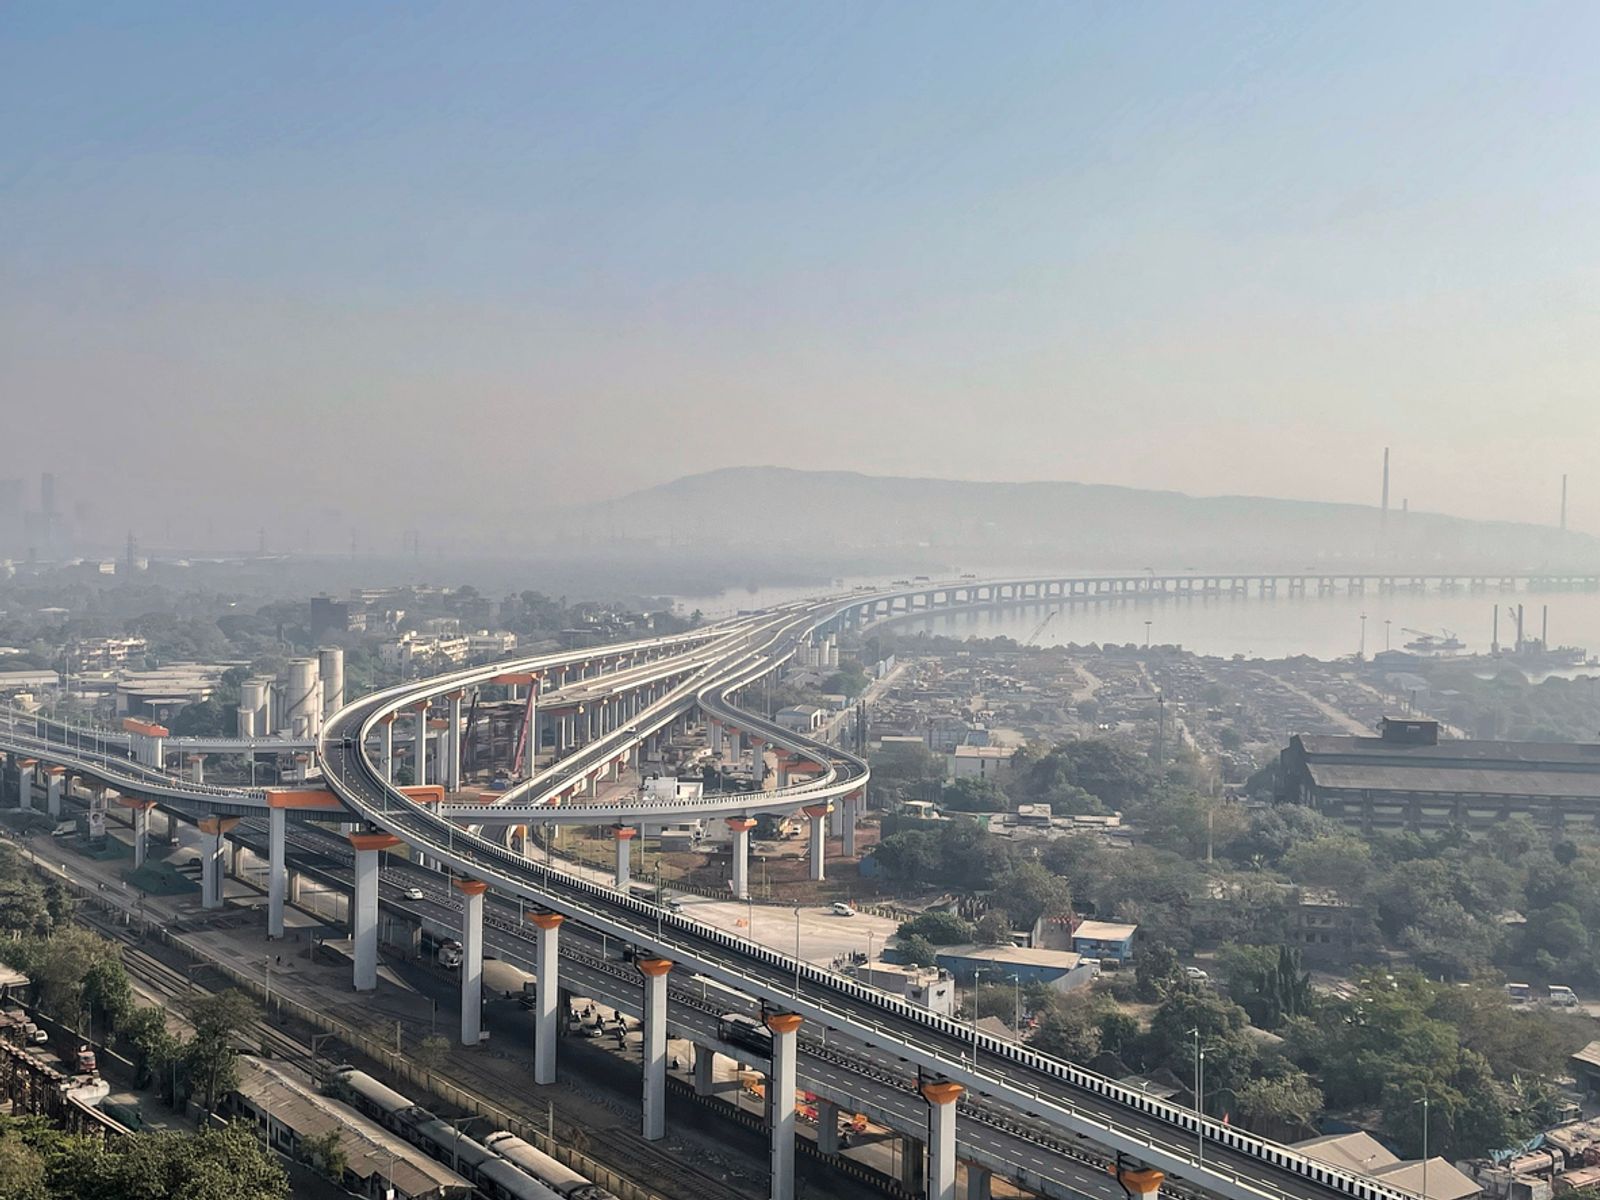
India's ₹208.83 trillion National Infrastructure Pipeline (as of 27 April 2026) is one of the most ambitious public investment programmes in the world. It spans roads, railways, ports, power, urban systems and digital infrastructure. But scale alone is not the story. Cost overruns, delivery delays and capacity constraints are undermining outcomes. Policymakers, developers, and financiers are no longer questioning whether India can plan. They are questioning whether it can deliver. The credibility of the entire programme now rests on closing that gap.
Not all states in India are moving at the same pace. Infrastructure outcomes are diverging sharply across states. States (led by Maharashtra, Gujarat, Karnataka, Telangana, Tamil Nadu, Haryana, Kerala, Odisha, Goa and Sikkim, followed by Uttar Pradesh) with stronger project management units (PMUs) are executing faster because approval speed and governance quality matter when converting delivery capability into a tangible advantage. Some are seeing measurable progress, while others continue to lag despite similar allocations.
The NIP aggregated projects across ministries, states, and sectors into a single pipeline, for better visibility, coordination, and capital mobilisation.

Sectoral allocation favours transport (especially roads and railways) heavily, followed by energy (particularly renewables), urban infrastructure, and water management.
According to ICRA, a professional investment information and credit rating agency, and India Investment Grid, capital is concentrated as below:
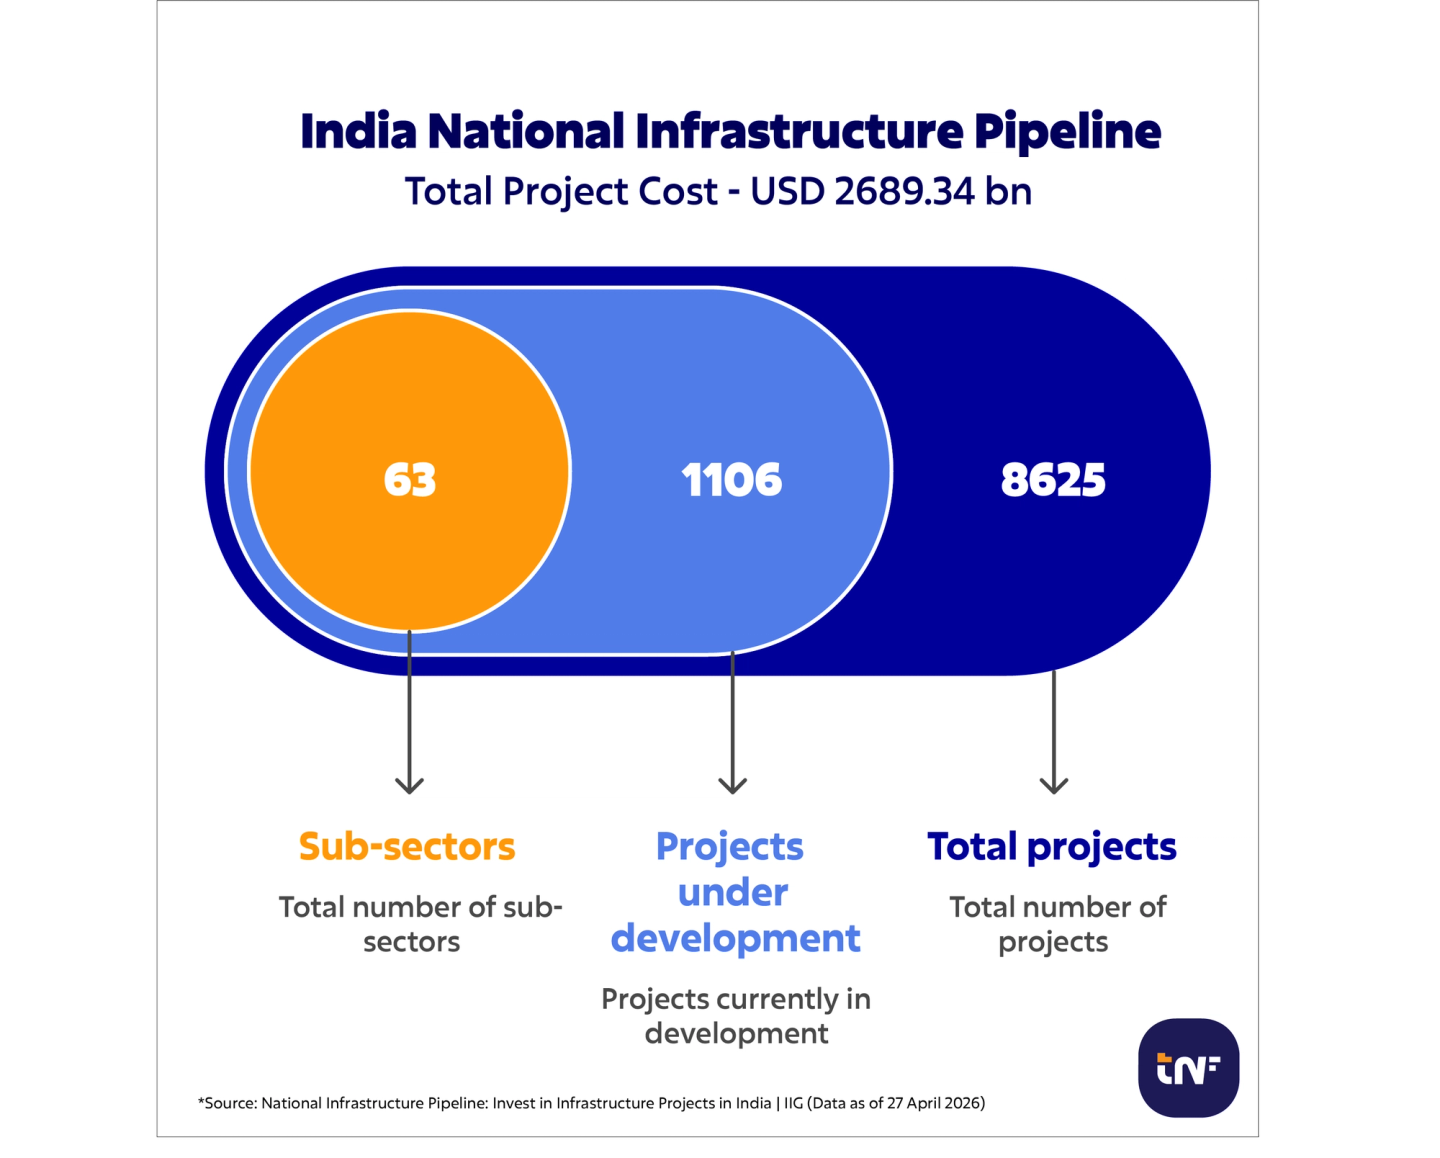
*Source: National Infrastructure Pipeline: Invest in Infrastructure Projects in India | IIG(Data as of 27 April 2026)
This bifurcation makes sense given India’s urbanisation pressures, energy transition needs and logistics costs, which are estimated at 7.97% of GDP. FY26 investments of ₹26.62 trillion in the first 9 months propose to put 48% in infrastructure, 22.6% in electricity (power), 17.3% in metals for infra inputs, and transport services. PPP pipelines worth ₹17 trillion for FY26-28 support this capex-led focus.
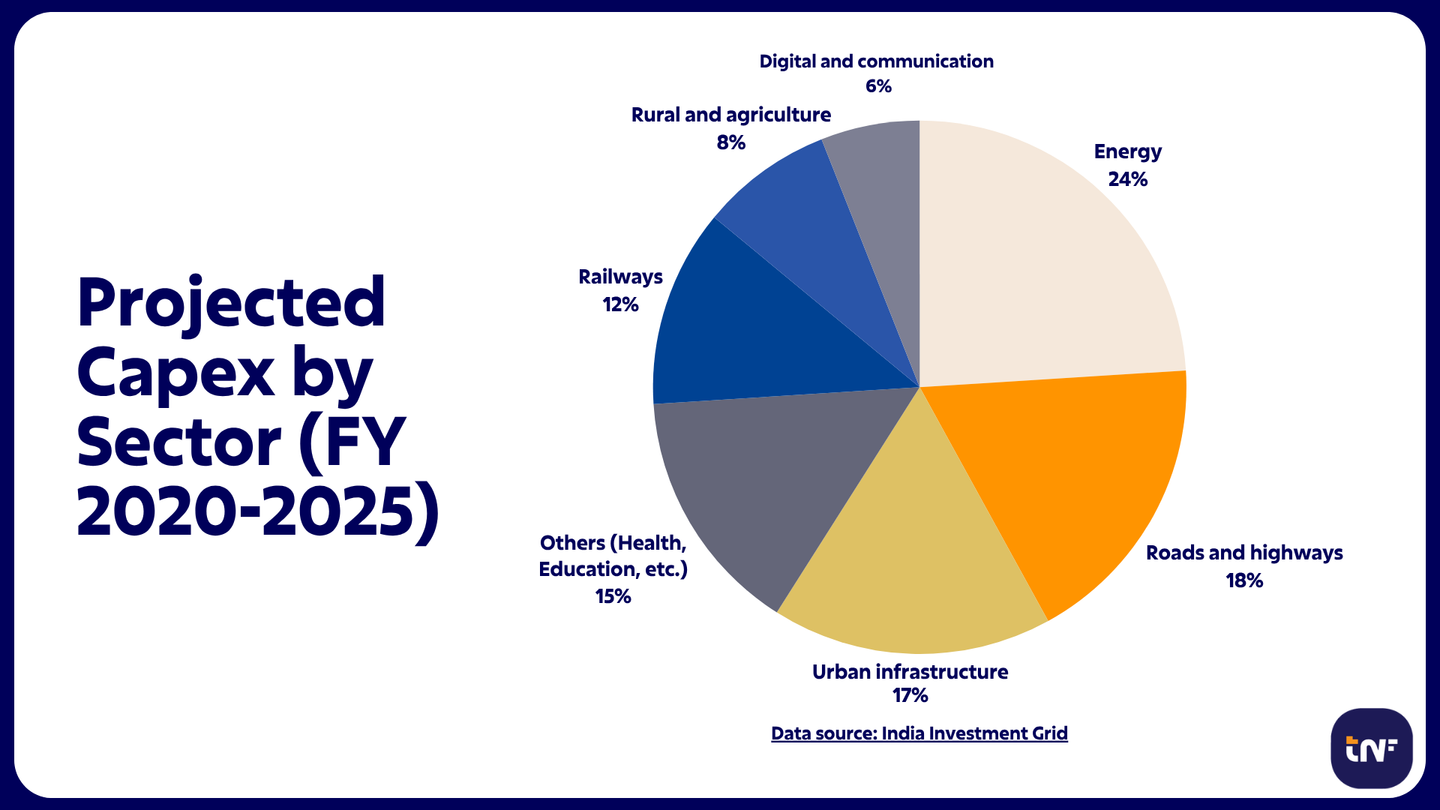
Data source: India Investment Grid
Allocations hit roadblocks: A significant proportion of NIP projects in urban infrastructure and railways continue to be in pre-construction or early tendering stages. While urban projects are hit by challenges with coordination between multiple agencies, railway projects get blocked by safety-related approvals and land acquisition issues. Roads and renewables perform better due to their mature contractor ecosystems, standardised EPC/PPP models, and centralised implementing agencies. Each state, like each sector, has its own challenges, and execution is not uniform. Gating factors and low throughput are widening the pipeline to delivery gap and leading to a lag in time to revenue.
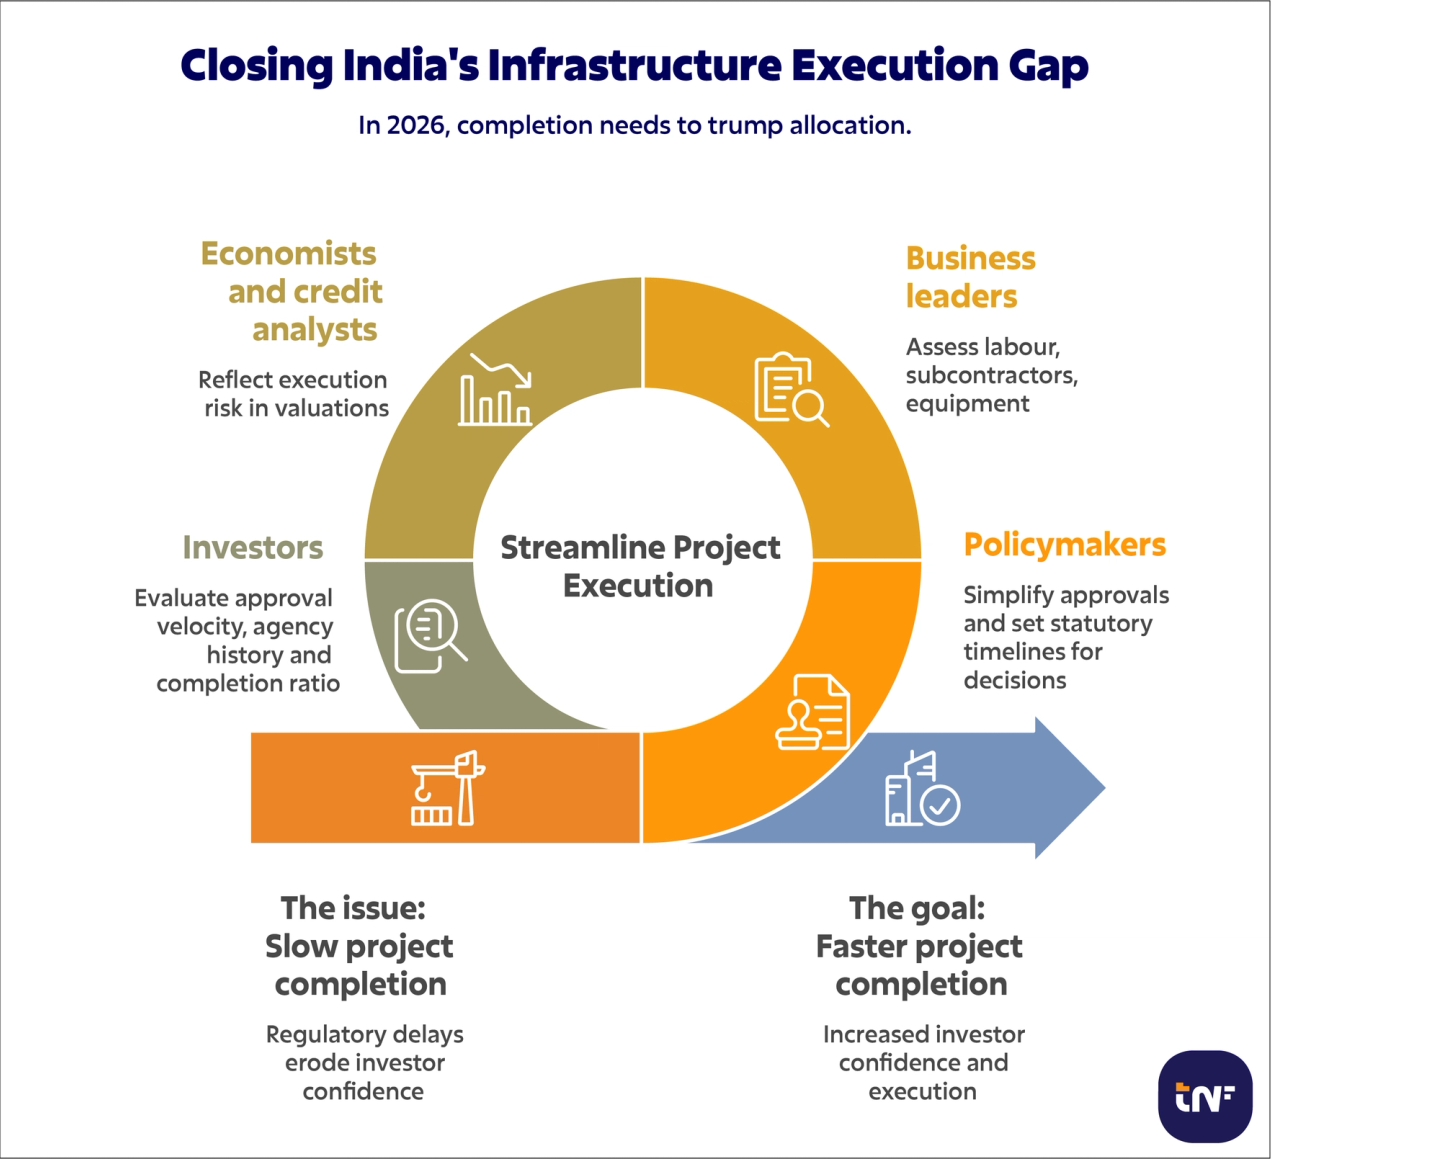
Persistent bottlenecks continue to constrain execution, despite transparent processes in tendering and digital monitoring. Traditional project planning has consistently hampered execution due to rigid timelines, fragmented ownership, and contract-driven approach. Let us look at the top four friction points, as identified by publicly available research, which may remain unrelenting in 2026 too.
Land acquisition and Right of Way (RoW) Risks: Acquisition of land poses a significant challenge to project timelines. Even with statutory acquisition, a project may run into bottlenecks. The shifting of utilities, forest clearances and local litigation can stall physical progress for months, if not years. Road projects, on the other hand, fare better with front-loaded land acquisition policies, unlike railways, urban transit and transmission lines.
Labour availability and productivity: Labour availability alone does not guarantee productivity, when projects suffer from weak skilling, low mechanisation and fragmented subcontracting. Contractors may have healthy order books, but fail to convert them to billed revenue, unless they ensure labour productivity.
Volatile supply chains: According to CRISIL Intelligence, steel, cement, and equipment costs are stable compared to 2021-22 levels, but volatility in supply remains a challenge, hurting margins. Winning large EPC contracts with fixed-price elements may prove hard to manage for mid-tier contractors.
Institutional capacity: Execution quality depends heavily on institutional bandwidth, whether at a ministry, state agency, or urban local body. These institutions often lack the skills or the technical prowess to manage multiple projects simultaneously. This inability is inversely proportionate to the size of the project in hand.

Accelerating execution timelines calls for scaled up adoption of digital tools, outcome-linked and modular contracting models. Efforts must be put in to shorten delivery cycles through tracking performance, costs, and safety in near real time through outcome-based metrics. Eliminating constraints and bottlenecks is the only solution to improve project management practices and predictability. Project delivery needs to be a continuous process, supported by clear escalation mechanisms and incentives that reward early completion.
Private investors are stepping in to bridge India’s infrastructure gap. With the National Monetisation Pipeline (NMP), Gati Shakti and other related reforms promising to improve project execution, we see private capital coming forward to bridge India’s infrastructure gap.

Asset monetisation, not privatisation: The National Monetisation Pipeline (NMP) has driven significant private investment in roads, power, airports, and warehousing by leasing out existing, functional assets. A key example is the NHAI’s ‘Toll, Operate, Transfer’ (TOT) model, which leases highways to private players for 20 to 30 years. This strategy allows the government to raise capital for new construction while transferring the financial risk of fluctuating demand to long-term investors.
Mobilising long-term capital and blended finance
Infrastructure investment trusts (InvITs): InvITs have emerged as a reliable bridge between operational infrastructure and long-term capital such as pension funds, insurance companies, and sovereign investors, as per data from SEBI and other sponsoring entities. Developers face less balance-sheet stress with such investment vehicles, which helps align risk-return expectations of long-term capital.
Multilateral and blended finance: The catalytic role played by institutions like the World Bank and IFC helps reduce risks in early-stage funding through guarantees and by promoting institutional reforms. 2026 may see the mobilisation of higher private capital than before with better governance and execution. However, execution bottlenecks could actively reshape where capital flows. Attracting funding without executing on time is bound to affect investor sentiment and hurt inflows.
Predictive trends for project delivery

Whether India closes its execution gap in 2026 will depend less on what is being tried and more on how consistently it is applied. The structural shifts underway across technology, contracting and institutional capacity are real. So is the risk that uneven implementation across states and agencies blunts their effect. Here is what to watch:
Disclaimer: Content provided by TNF India is for informational purposes only. While we aim to provide accurate data and strategic insights, information is subject to rapid market and technological shifts. This content should not replace independent due diligence or professional consultation. TNF India bears no responsibility for any actions taken, or financial losses incurred, in reliance on this material.








Decoding deals, developments, regulations, and government directives shaping cross-border business between India and BRICS partners.

Who India's financial system trusts, and on what evidence.

What an owner should receive at handover, and what actually arrives.